SpotCollector Online Help Contents
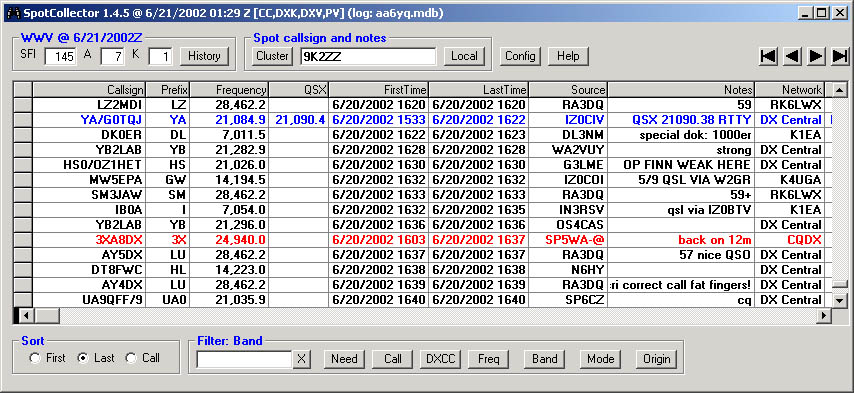
While its primary role is to collect spots, SpotCollector also facilitates propagation prediction by by capturing the current solar flux and geomagnetic indices that are conveyed as WWV information by the spot sources to which it is connected:
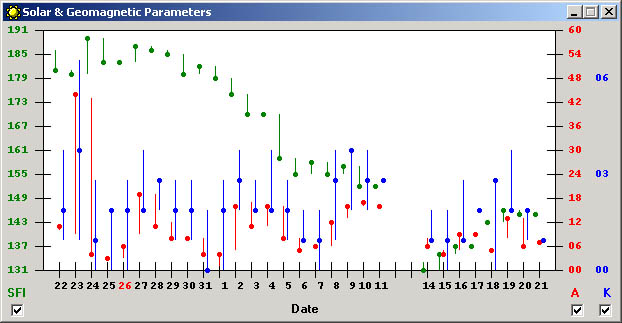
These parameters are automatically captured and recorded. The most recent values for these parameters are shown in the WWV panel in the upper left of SpotCollector's Spot Database window . A graphical view of these parameters over the most recent 31 days can be viewed by clicking the WWV panel's Hist button; given the sun's 27-day rotation period, this view can be helpful in predicting future propagation. The bottom and top of each vertical line indicate its parameter's minimum and maximum value over a day's 24 hours, respectively; the solid dot indicates its parameter's last value that day. Depressing the CTRL key while clicking the Hist button will ensure that the window displaying the graphical view appears "on top" if it should overlap with SpotCollector's Main window.
SpotCollector automatically conveys the most recent SFI to PropView, allowing propagation prediction without manual entry of this parameter.
If the A-index exceeds 30, the letter
A in the WWV
panel is displayed in bold red font to indicate that the ionosphere
is disturbed by a geomagnetic storm. The A box's background color indicates the
its range:
| Range | Level |
| 31-47 | Minor |
| 48-55 | Moderate |
| 56-63 | Strong |
| 64-71 | Severe |
| >71 | Extreme |
You can
configure
SpotCollector to play a thunderclap sound when the A-index exceeds 30 at
startup, or when the A-index is reported to increase to a value greater than 30.
The K box's background color indicates the
National Oceanic and Atmospheric Administration's
G-scale:
| Scale | Level |
| G1 | Minor |
| G2 | Moderate |
| G3 | Strong |
| G4 | Severe |
| G5 | Extreme |
You can optionally display a Smoothed Sunspot Number estimated from the last-reported solar flux index by double clicking the word SFI in the WWV panel; clicking the word SSN will display the last-reported solar flux index. The Smoothed Sunspot Number is estimated using the equation
S = (33.52 x (85.12 +SFI)1/2) -408.99
as shown on page 23-25 of the ARRL Antenna Handbook, 16th Edition.