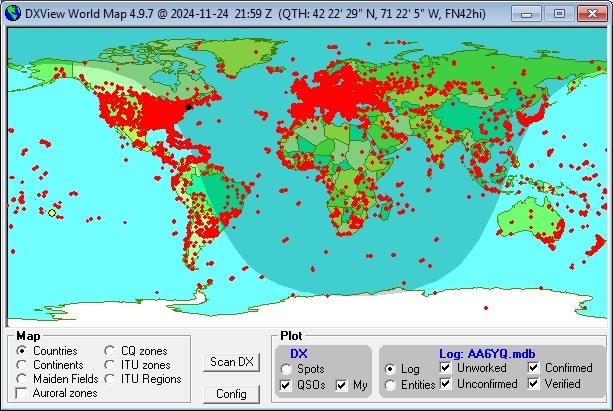
Plotting Logged QSOs on DXView's World Map
To plot logged QSOs that specify a location (grid square or latitude and longitude) from the Log Page Display
Filter DXKeeper's Log Page Display to contain the QSOs to be plotted; to plot all QSOs in your log, click the Filter panel's X button at the bottom of the Log QSOs tab of DXKeeper's Main window.
Just above the Log Page Display on the Log QSOs tab of DXKeeper's Main window, click the Plot button.
In DXView's World Map window, the Plot panel will have changed from Spots to Filtered QSOs; check or uncheck the Unworked, Unconfirmed, Confirmed, and Verified boxes to filter the plotted QSOs as desired.
By default, DXView uses small red dots to represent logged QSOs; you can adjust this in the Graphics panel on the World Map tab of DXView's Configuration window.

If Google Earth is installed and enabled, QSOs plotted on DXView's World Map will also be plotted on Google Earth.
Post a question or suggestion on the DXLab Discussion Group
Plotting Logged QSOs on the DX Atlas World Map
Plotting Worked and Confirmed Grid Squares on the DX Atlas World Map
